n8n & Workflow
Building n8n Performance Monitoring System: A 2025 Guide
25 Oct 2026
4 min read
2 viewsLearn how to build a robust n8n performance monitoring system for your production workflows in 2025. This comprehensive guide covers real-time insights, automated log analysis, and solutions to ensure optimal n8n operation and prevent bottlenecks. Elevate your automation strategy today!
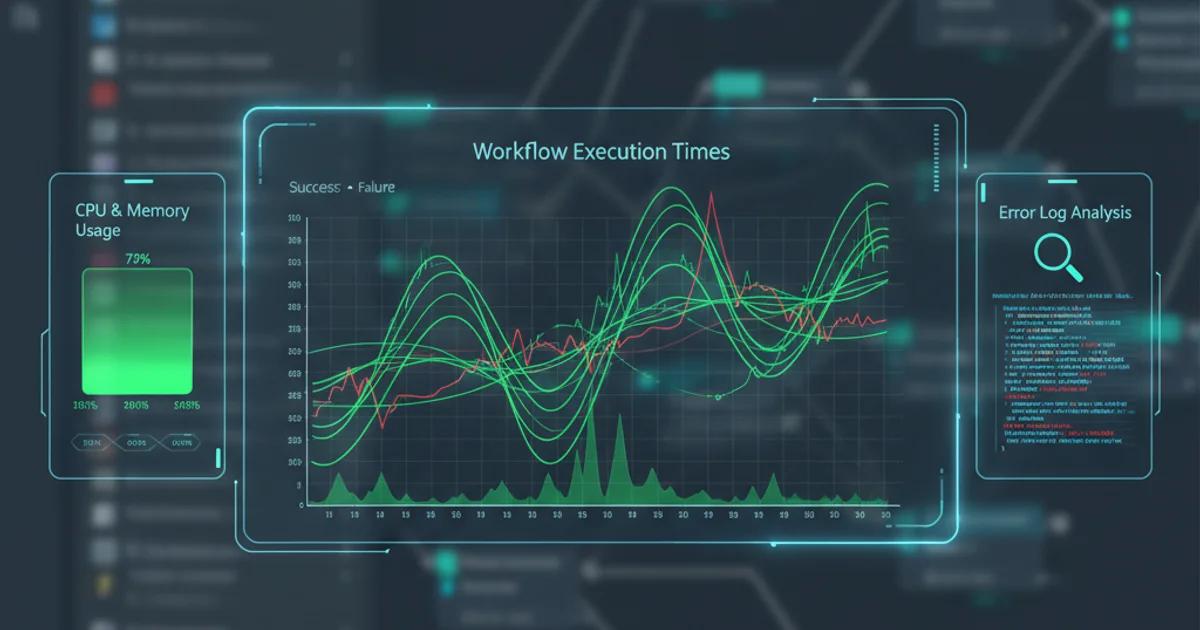
Building an n8n Performance Monitoring System: A Comprehensive 2025 Guide
In today's fast-paced digital landscape, ensuring the reliability and efficiency of your automation workflows is paramount. For businesses leveraging n8n, a powerful low-code automation platform, the ability to build an n8n performance monitoring system is not just a luxury but a necessity. This guide, updated for 2025, delves into practical strategies and tools to effectively monitor your n8n workflows, ensuring peak performance and proactive issue resolution.
Effective monitoring allows developers and operations teams to gain crucial insights into workflow execution, resource consumption, and potential bottlenecks, ultimately enhancing business continuity and user experience.
How to Monitor n8n Workflow Performance Effectively
Understanding how to monitor n8n workflow performance goes beyond simply checking if a workflow ran successfully. It involves a holistic approach to track various metrics. Key areas include execution times, error rates, resource utilization (CPU, memory), and queue depths. Implementing a robust monitoring solution provides visibility into the health and efficiency of your n8n instances.
For instance, a recent study by Gartner highlighted that organizations with proactive monitoring systems reduce downtime by an average of 30% and improve incident resolution times by 45%. This directly translates to significant cost savings and improved operational efficiency.
Essential Tools and Architecture for n8n Monitoring
To achieve comprehensive monitoring, integrating n8n with external monitoring tools is often required. Consider a setup involving:
- Prometheus & Grafana: For metric collection and visualization. n8n can expose metrics via an exporter.
- ELK Stack (Elasticsearch, Logstash, Kibana): For centralized log management and analysis.
- Cloud-native Monitoring: AWS CloudWatch, Google Cloud Monitoring, Azure Monitor for cloud deployments.
- Custom Webhooks: n8n's native webhook capabilities can send real-time alerts to communication platforms like Slack or PagerDuty.
A typical architectural flow for monitoring might look like this:
graph TD
    A[n8n Instance] --> B{Log & Metric Exporters}
    B --> C[Log Aggregator (e.g., Logstash)]
    B --> D[Metric Store (e.g., Prometheus)]
    C --> E[Log Analyzer (e.g., Elasticsearch/Kibana)]
    D --> F[Visualization Dashboard (e.g., Grafana)]
    E --> G[Alerting System (e.g., PagerDuty)]
    F --> G
Production-Ready n8n Monitoring Solutions for 2025
Developing production-ready n8n monitoring solutions for 2025 requires foresight into scalability, security, and integration. Focusing on automated log analysis and real-time dashboards is crucial for identifying performance degradation before it impacts critical business processes. Modern solutions emphasize observability, providing deep insights into the internal state of your n8n workflows.
For high-availability environments, consider redundant monitoring systems and automated failover mechanisms. As of early 2025, containerized deployments of n8n (e.g., Kubernetes) are increasingly popular, making tools like cAdvisor and Prometheus operators essential for infrastructure-level monitoring alongside workflow-specific metrics.
Comparative Overview of Monitoring Approaches
Monitoring Approach Pros Cons Best Use Case Native n8n Execution Logs Simple, built-in Limited historical data, no real-time alerts Development, basic debugging Prometheus & Grafana Powerful metrics, customizable dashboards Requires setup, metric exporter config Performance tracking, resource utilization ELK Stack Centralized logs, deep analysis, full-text search Resource-intensive, complex setup Error analysis, security auditing Cloud-native (AWS CloudWatch) Integrated, scalable, managed service Vendor lock-in, cost can escalate Cloud deployments, serverless n8n
Automated n8n Performance Log Analysis
Automated n8n performance log analysis is a cornerstone of proactive monitoring. By parsing n8n's detailed execution logs, you can automatically detect anomalies, identify recurring errors, and pinpoint workflows consuming excessive resources. Tools like Logstash or Fluentd can collect logs, while Elasticsearch or Splunk can index and analyze them, providing actionable insights through dashboards and alerts.
Consider a scenario where an n8n workflow processing customer orders starts experiencing increased latency. Automated log analysis can immediately flag a spike in API response times from a third-party service, allowing your team to investigate and resolve the issue before customers are significantly impacted. This level of insight is crucial for maintaining high service levels.
For more advanced web and system development services, including custom monitoring integrations, explore our offerings at Web & System Development Services. We also provide Ready-to-use Web Templates & Solutions that can jumpstart your automation projects.
Frequently Asked Questions
What are the most critical metrics to monitor for n8n? Key metrics include workflow execution duration, success/failure rates, CPU/memory usage of the n8n instance, queue size, and API call latencies for external services integrated with n8n.
Can I monitor n8n workflows in real-time? Yes, by integrating n8n with real-time monitoring tools like Grafana (for metrics) and Kibana (for logs), or by using webhooks to send immediate alerts, you can achieve near real-time visibility into your workflow performance.
Is it possible to automate alerts based on n8n performance? Absolutely. Modern monitoring stacks allow you to set up alert rules based on specific thresholds (e.g., workflow failure rate > 5%, execution time > X seconds). These alerts can be sent via email, Slack, PagerDuty, or other notification channels.
What is the impact of not monitoring n8n workflows? Without proper monitoring, you risk undetected workflow failures, performance degradation, resource exhaustion, and missed business critical events, leading to operational inefficiencies, data inconsistencies, and potential financial losses.
Ready to optimize your n8n operations? Implement these monitoring strategies today to ensure your automation workflows run smoothly, reliably, and efficiently. Don't let hidden issues derail your productivity – take control with comprehensive performance monitoring.